
Zabbix 应用服务监控 Nginx Redis PHP MySQL

监控Nginx服务
| 角色 | IP | 服务 |
|---|---|---|
| zabbix-server | 172.16.1.71 | zabbix-server |
| web01 | 172.16.1.7 | Nginx |
#安装nginx
[root@web01 ~]# cat /etc/yum.repos.d/nginx.repo
[nginx-stable]
name=nginx stable repo
baseurl=http://nginx.org/packages/centos/releasever/basearch/
gpgcheck=1
enabled=1
gpgkey=https://nginx.org/keys/nginx_signing.key
module_hotfixes=true
[root@web01 ~]# yum install -y nginx
#配置站点查看nginx状态
[root@web01 ~]# cat /etc/nginx/conf.d/default.conf
server {
listen 80;
server_name localhost;
location / {
root /usr/share/nginx/html;
index index.html index.htm;
}
error_page 500 502 503 504 /50x.html;
location = /50x.html {
root /usr/share/nginx/html;
}
location /nginx_status {
stub_status on;
allow 127.0.0.1;
deny all;
}
}
[root@web01 ~]# nginx -t
[root@web01 ~]# systemctl enable nginx
[root@web01 ~]# systemctl start nginx
[root@web01 ~]# netstat -lntp| grep nginx
tcp 0 0 0.0.0.0:80 0.0.0.0:* LISTEN 29521/nginx: master
[root@web01 ~]# curl http://127.0.0.1/nginx_status
Active connections: 1 #当前活跃的客户端连接数
server accepts #已接受总的tcp连接数 handled #已处理的总的tcp连接数 requests #客户端的总的http请求数
3 3 3
Reading: 0 Writing: 1 Waiting: 0
当期nginx的请求头的连接数 nginx响应客户端的连接数 当前等待请求空闲的客户端连接数
[root@web01 ~]# mkdir -p /etc/zabbix/scripts
#编辑nginx状态取值脚本
[root@web01 /etc/zabbix/scripts]# cat nginx_status.sh
#!/bin/bash
NGINX_PORT=80 #如果端口不同仅需要修改脚本即可,否则修改xml很麻烦
NGINX_COMMAND=1
nginx_active(){
/usr/bin/curl -s "http://127.0.0.1:"NGINX_PORT"/nginx_status/" |awk '/Active/ {print NF}'
}
nginx_reading(){
/usr/bin/curl -s "http://127.0.0.1:"NGINX_PORT"/nginx_status/" |awk '/Reading/ {print 2}'
}
nginx_writing(){
/usr/bin/curl -s "http://127.0.0.1:"NGINX_PORT"/nginx_status/" |awk '/Writing/ {print 4}'
}
nginx_waiting(){
/usr/bin/curl -s "http://127.0.0.1:"NGINX_PORT"/nginx_status/" |awk '/Waiting/ {print 6}'
}
nginx_accepts(){
/usr/bin/curl -s "http://127.0.0.1:"NGINX_PORT"/nginx_status/" |awk 'NR==3 {print 1}'
}
nginx_handled(){
/usr/bin/curl -s "http://127.0.0.1:"NGINX_PORT"/nginx_status/" |awk 'NR==3 {print 2}'
}
nginx_requests(){
/usr/bin/curl -s "http://127.0.0.1:"NGINX_PORT"/nginx_status/" |awk 'NR==3 {print 3}'
}
caseNGINX_COMMAND in
active)
nginx_active;
;;
reading)
nginx_reading;
;;
writing)
nginx_writing;
;;
waiting)
nginx_waiting;
;;
accepts)
nginx_accepts;
;;
handled)
nginx_handled;
;;
requests)
nginx_requests;
;;
*)
echo "USAGE:0 {active|reading|writing|waiting|accepts|handled|requests}"
esac
#测试脚本
[root@web01 /etc/zabbix/scripts]# sh nginx_status.sh active
1
#添加执行权限
[root@web01 /etc/zabbix/scripts]# chmod +x nginx_status.sh
#编写客户端配置文件
[root@web01 /etc/zabbix/zabbix_agentd.d]# cat nginx.conf
UserParameter=nginx_status[*],/bin/bash /etc/zabbix/scripts/nginx_status.sh "$1"
[root@web01 /etc/zabbix/zabbix_agentd.d]# systemctl restart zabbix-agent.service
#服务端进行取值测试
[root@zabbix-server ~]# zabbix_get -s 172.16.1.7 -p10050 -k nginx_status[active]
1
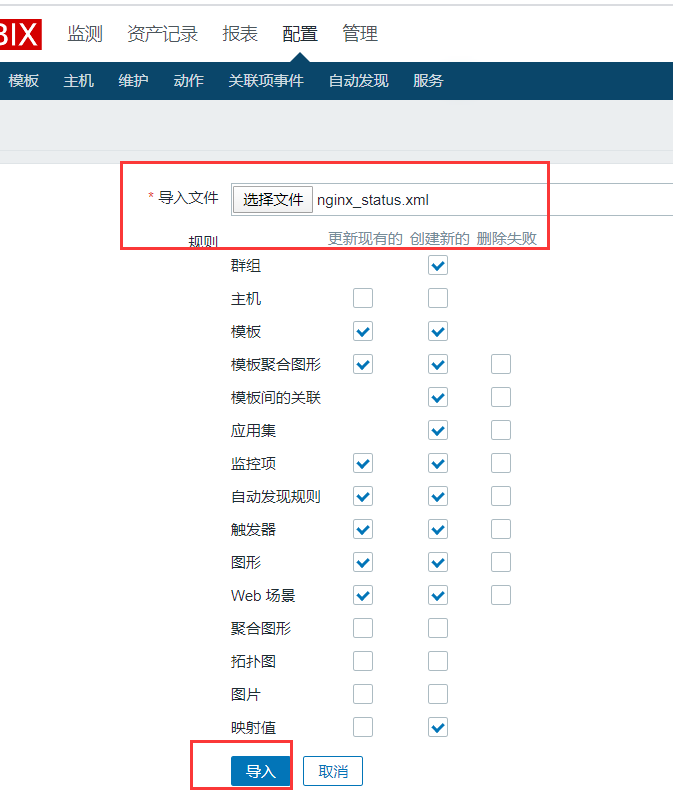
#web配置监控项(导入模板)
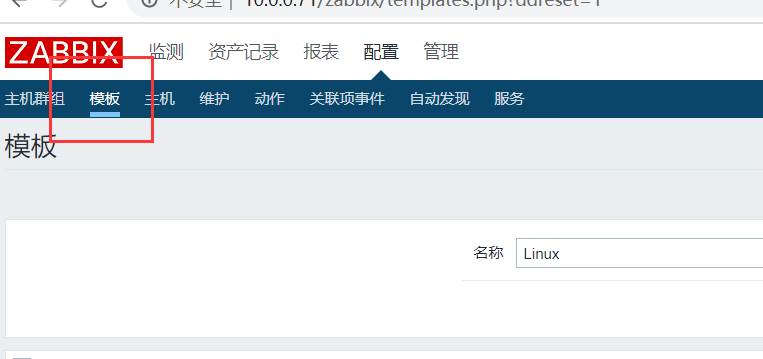
 导入模板
导入模板
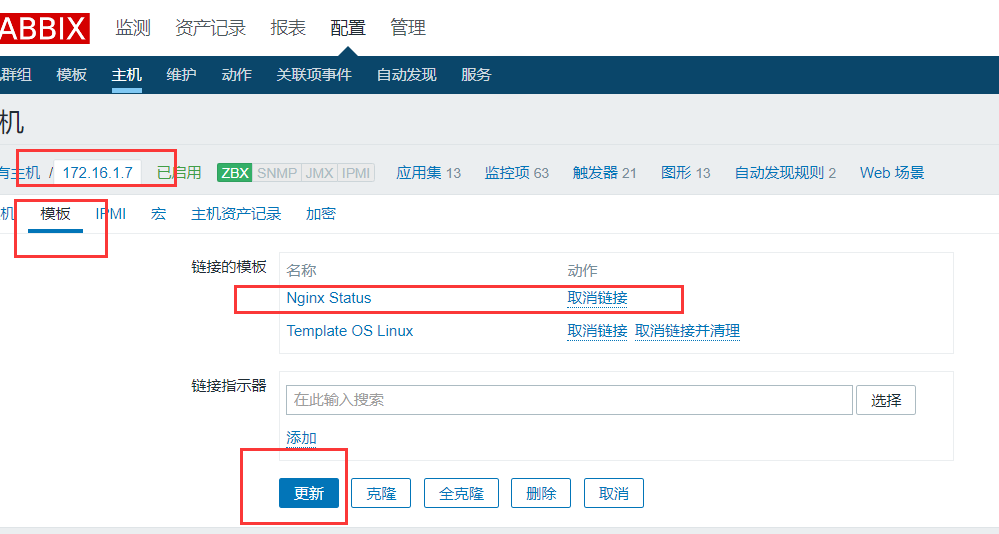 将模板链接到主机
 添加监控成功
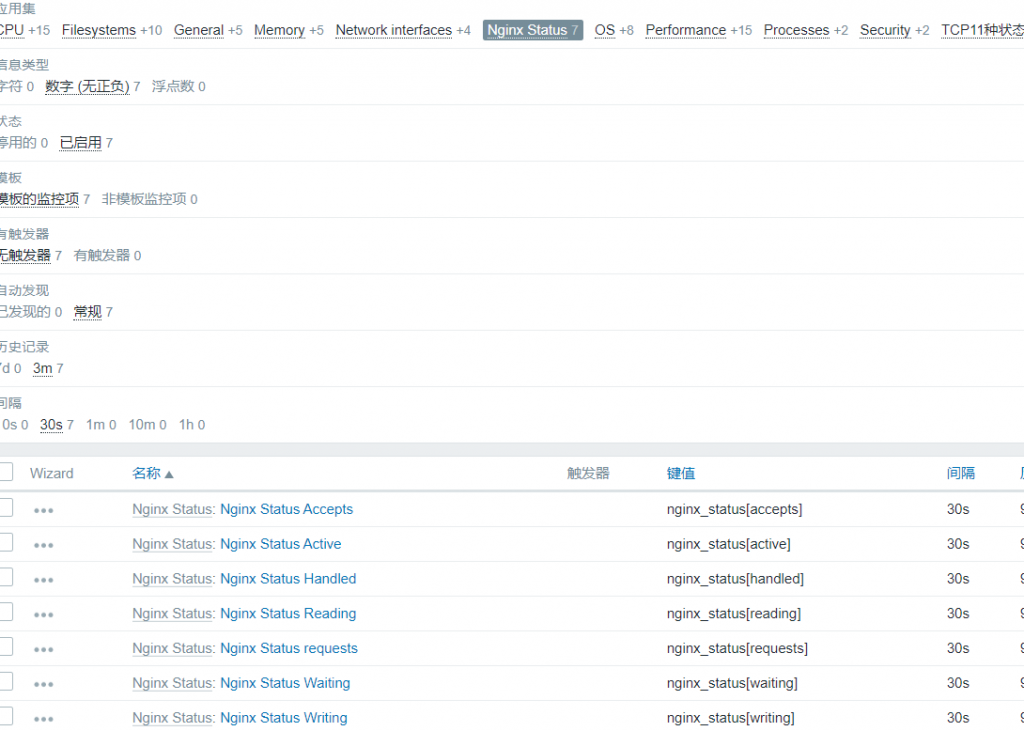
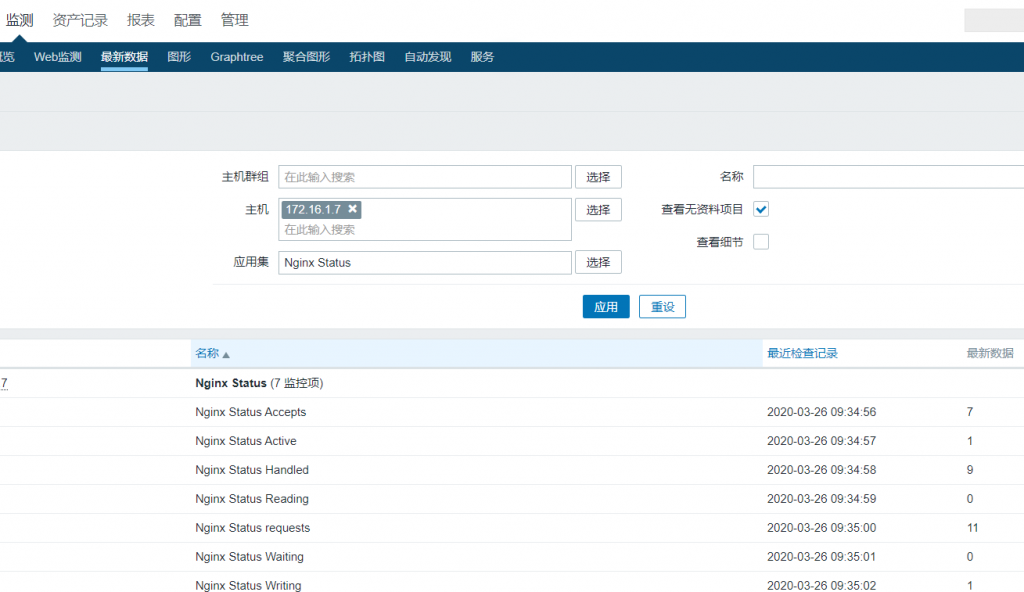 检测>最新数据>选择应用集
制作模板并导出
 配置>模板>创建模板

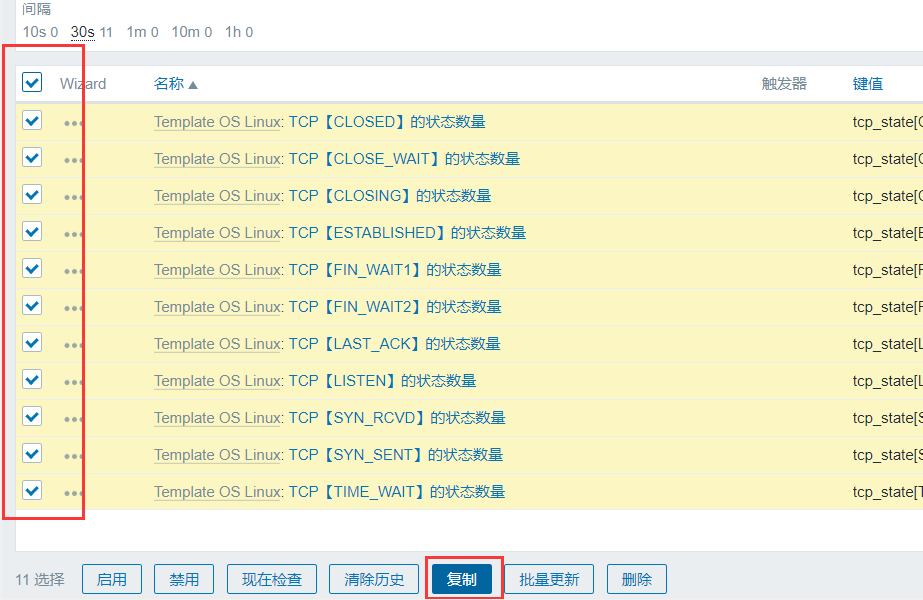 选择对应的监控项复制到模板

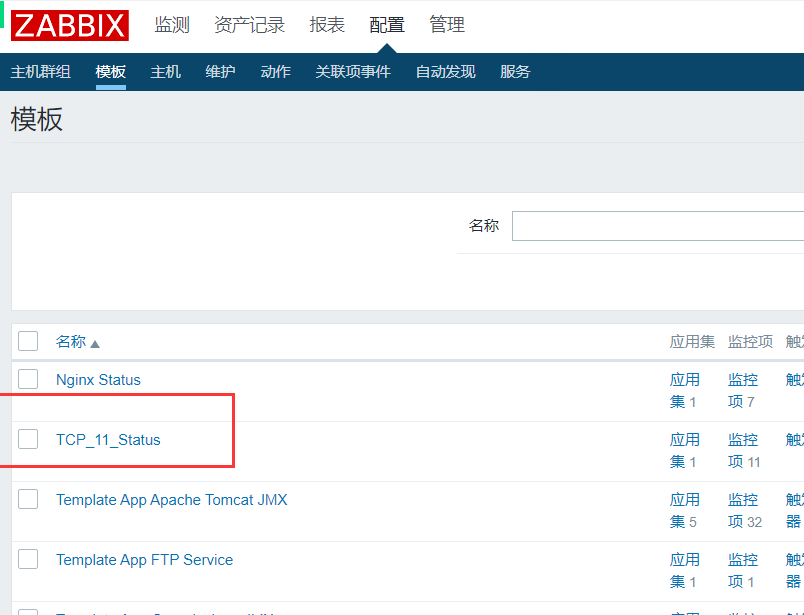 模板创建成功
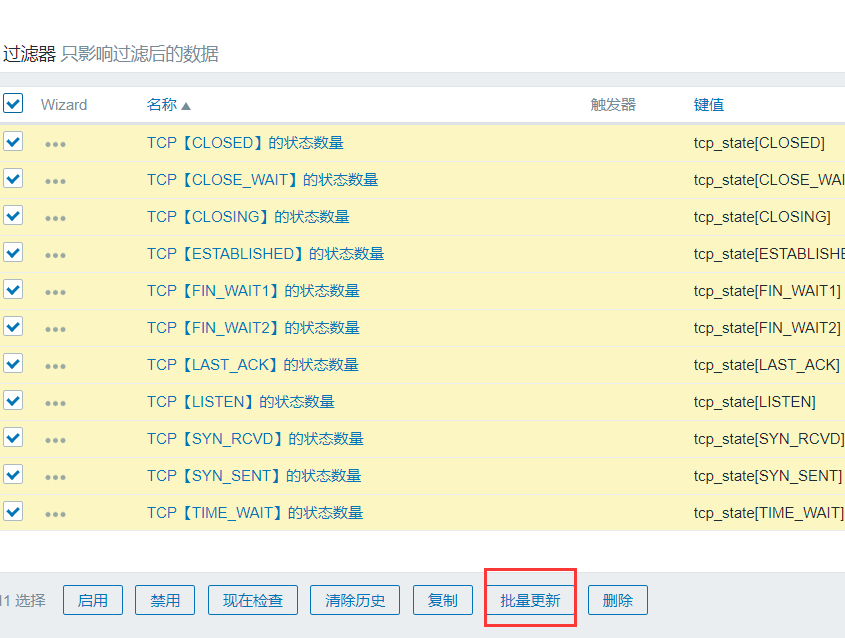 创建应用集
创建应用集

 配置>模板>拉到最下方导出
监控PHP服务
#下载php服务
root@web01 ~]# yum remove php-mysql-5.4 php php-fpm php-common -y

[root@web01 ~]# cat /etc/yum.repos.d/php.repo
[php]
name = php Repository
baseurl = http://us-east.repo.webtatic.com/yum/el7/x86_64/
gpgcheck = 0

[root@web01 ~]# yum -y install php71w php71w-cli php71w-common php71w-devel php71w-embedded php71w-gd php71w-mcrypt php71w-mbstring php71w-pdo php71w-xml php71w-fpm php71w-mysqlnd php71w-opcache php71w-pecl-memcached php71w-pecl-redis php71w-pecl-mongodb

#修改php-fpm配置文件
[root@web01 ~]# grep '^pm.status' /etc/php-fpm.d/www.conf
pm.status_path = /phpfpm_status

#站点配置
[root@web01 ~]# cat /etc/nginx/conf.d/default.conf
server {
    listen       80;
    server_name  localhost;
    location / {
        root   /usr/share/nginx/html;
        index  index.html index.htm;
    }
    error_page   500 502 503 504  /50x.html;
    location = /50x.html {
        root   /usr/share/nginx/html;
    }
    location /nginx_status {
    stub_status on;
    allow  127.0.0.1;
    deny all;
    }

#新增
    location ~ /(phpfpm_status){
        root           html;
        fastcgi_pass   127.0.0.1:9000;
        fastcgi_index  index.php;
        fastcgi_param  SCRIPT_FILENAME  /scriptsfastcgi_script_name;
        include        fastcgi_params;
    }
}

#启动php
[root@web01 ~]# systemctl  start php-fpm.service
[root@web01 ~]# systemctl  enable php-fpm.service

#重启nginx
[root@web01 ~]# nginx -t
[root@web01 ~]# systemctl  restart nginx

#访问测试
[root@web01 ~]# curl  http://127.0.0.1/phpfpm_status
pool:                 www       #fpm地址池名称
process manager:      dynamic   #进程的管理方式
start time:           26/Mar/2020:10:26:59 +0800        #启动时间
start since:          165                       #运行时间  秒级
accepted conn:        1                         #当前地址池的请求数
listen queue:         0                         #请求的等待队列,不为0,则需要增加FPM的进程数量
max listen queue:     0                         #请求等待队列的最高数量
listen queue len:     128                       #socket等待队列长度
idle processes:       4                         #空闲的进程数量
active processes:     1                         #活跃的进程数量
total processes:      5                         #总进程数量
max active processes: 1                         #最大的进程活跃数量
max children reached: 0                         #进程最大数量限制的次数,不为0,说明最大进程数量过小
slow requests:        0                         #慢请求的次数

#编写脚本
[root@web01 /etc/zabbix/scripts]# cat phpfpm_status.sh
#!/bin/bash
PHPFPM_COMMAND=1
PHPFPM_PORT=80 #根据监听不同端口进行调整
start_since(){
    /usr/bin/curl -s "http://127.0.0.1:"PHPFPM_PORT"/phpfpm_status" |awk '/^start since:/ {print NF}'
}
accepted_conn(){
    /usr/bin/curl -s "http://127.0.0.1:"PHPFPM_PORT"/phpfpm_status" |awk '/^accepted conn:/ {print NF}'
}
listen_queue(){
    /usr/bin/curl -s "http://127.0.0.1:"PHPFPM_PORT"/phpfpm_status" |awk '/^listen queue:/ {print NF}'
}
max_listen_queue(){
    /usr/bin/curl -s "http://127.0.0.1:"PHPFPM_PORT"/phpfpm_status" |awk '/^max listen queue:/ {print NF}'
}
listen_queue_len(){
    /usr/bin/curl -s "http://127.0.0.1:"PHPFPM_PORT"/phpfpm_status" |awk '/^listen queue len:/ {print NF}'
}
idle_processes(){
    /usr/bin/curl -s "http://127.0.0.1:"PHPFPM_PORT"/phpfpm_status" |awk '/^idle processes:/ {print NF}'
}
active_processes(){
    /usr/bin/curl -s "http://127.0.0.1:"PHPFPM_PORT"/phpfpm_status" |awk '/^active processes:/ {print NF}'
}
total_processes(){
    /usr/bin/curl -s "http://127.0.0.1:"PHPFPM_PORT"/phpfpm_status" |awk '/^total processes:/ {print NF}'
}
max_active_processes(){
    /usr/bin/curl -s "http://127.0.0.1:"PHPFPM_PORT"/phpfpm_status" |awk '/^max active processes:/ {print NF}'
}
max_children_reached(){
    /usr/bin/curl -s "http://127.0.0.1:"PHPFPM_PORT"/phpfpm_status" |awk '/^max children reached:/ {print NF}'
}
slow_requests(){
    /usr/bin/curl -s "http://127.0.0.1:"PHPFPM_PORT"/phpfpm_status" |awk '/^slow requests:/ {print NF}'
}
casePHPFPM_COMMAND in
    start_since)
        start_since;
        ;;
    accepted_conn)
        accepted_conn;
        ;;
    listen_queue)
        listen_queue;
        ;;
    max_listen_queue)
        max_listen_queue;
        ;;
    listen_queue_len)
        listen_queue_len;
        ;;
    idle_processes)
        idle_processes;
        ;;
    active_processes)
        active_processes;
        ;;
    total_processes)
        total_processes;
        ;;
    max_active_processes)
        max_active_processes;
        ;;
    max_children_reached)
        max_children_reached;
        ;;
    slow_requests)
        slow_requests;
        ;;
    *)
        echo "USAGE:0 {start_since|accepted_conn|listen_queue|max_listen_queue|listen_queue_len|idle_processes|active_processes|total_processes|max_active_processes|max_children_reached|slow_requests}"
esac

#添加权限
[root@web01 /etc/zabbix/scripts]# chmod +x phpfpm_status.sh

#测试脚本
[root@web01 /etc/zabbix/scripts]# sh phpfpm_status.sh start_since
703

#编写客户端监控项文件
[root@web01 /etc/zabbix/scripts]# cd ../zabbix_agentd.d/
[root@web01 /etc/zabbix/zabbix_agentd.d]# vim phpfpm.conf
UserParameter=phpfpm_status[*],/bin/bash  /etc/zabbix/scripts/phpfpm_status.sh "$1"
[root@web01 /etc/zabbix/zabbix_agentd.d]# systemctl  restart zabbix-agent.service

#服务端测试
[root@zabbix-server ~]# zabbix_get  -s 172.16.1.7 -p10050 -k  phpfpm_status[start_since]
947
 配置>模板>导入

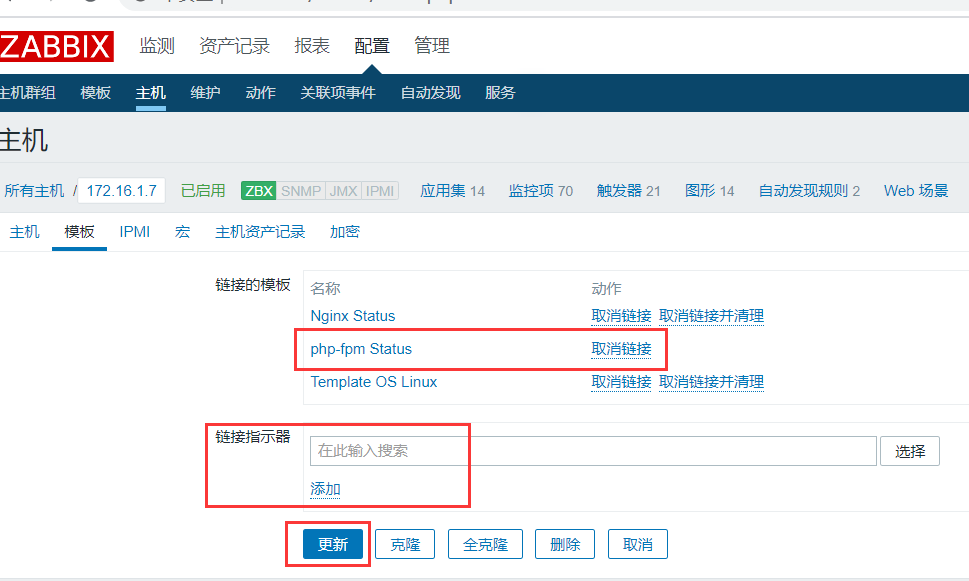 将模板链接到主机
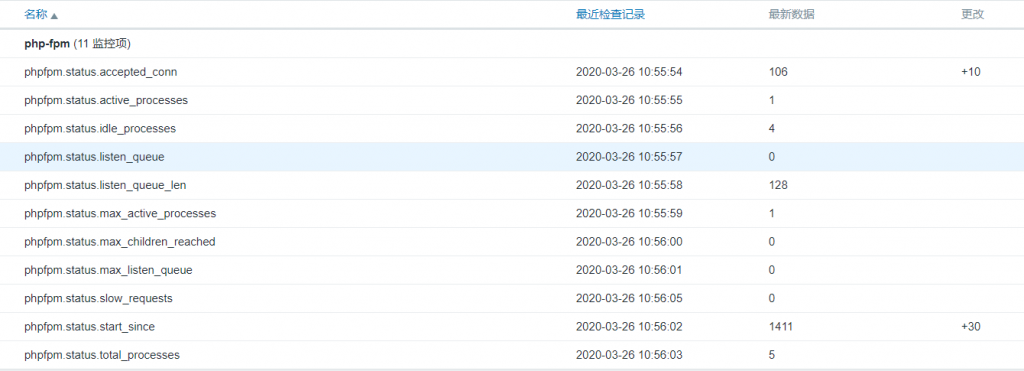 查看最新数据
监控MySQL服务
#安装mariadb
[root@web01 ~]# yum install -y mariadb-server
#启动mariadb
[root@web01 ~]# systemctl start mariadb.service
#数据库授权
[root@web01 ~]# mysql
MariaDB [(none)]> grant all on *.* to zabbix@'localhost' identified by '123456';
Query OK, 0 rows affected (0.00 sec)
#percona 主要负责监控数据库的插件
#安装percona插件
[root@web01 ~]# yum install -y https://www.percona.com/redir/downloads/percona-release/redhat/1.0-12/percona-release-1.0-12.noarch.rpm
[root@web01 ~]# yum install -y percona-zabbix-templates
[root@web01 ~]# tree /var/lib/zabbix/percona/
/var/lib/zabbix/percona/
├── scripts
│ ├── get_mysql_stats_wrapper.sh
│ └── ss_get_mysql_stats.php
└── templates
├── userparameter_percona_mysql.conf
└── zabbix_agent_template_percona_mysql_server_ht_2.0.9-sver1.1.8.xml
2 directories, 4 files
#配置文件
[root@web01 ~]# cp /var/lib/zabbix/percona/templates/userparameter_percona_mysql.conf /etc/zabbix/zabbix_agentd.d/
[root@web01 ~]# systemctl restart zabbix-agent.service
[root@web01 ~]# vim /var/lib/zabbix/percona/scripts/ss_get_mysql_stats.php
mysql_user = 'zabbix';mysql_pass = '123456';
$mysql_port = 3306;
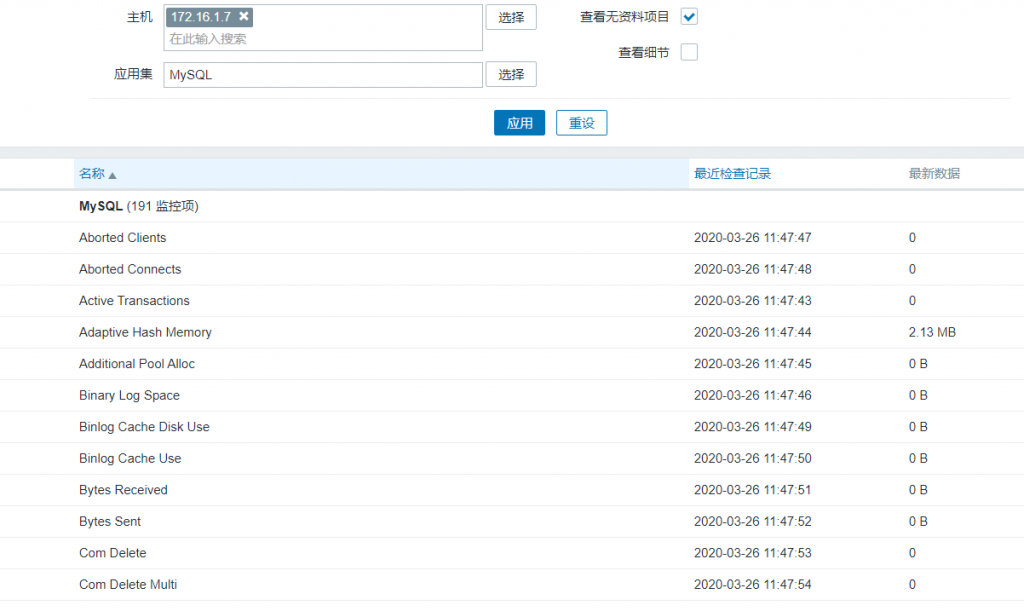
#取值测试
[root@zabbix-server ~]# zabbix_get -s 172.16.1.7 -p10050 -k MySQL.Sort-scan
0
https://blog.51cto.com/11555417/2052686 #参考文章
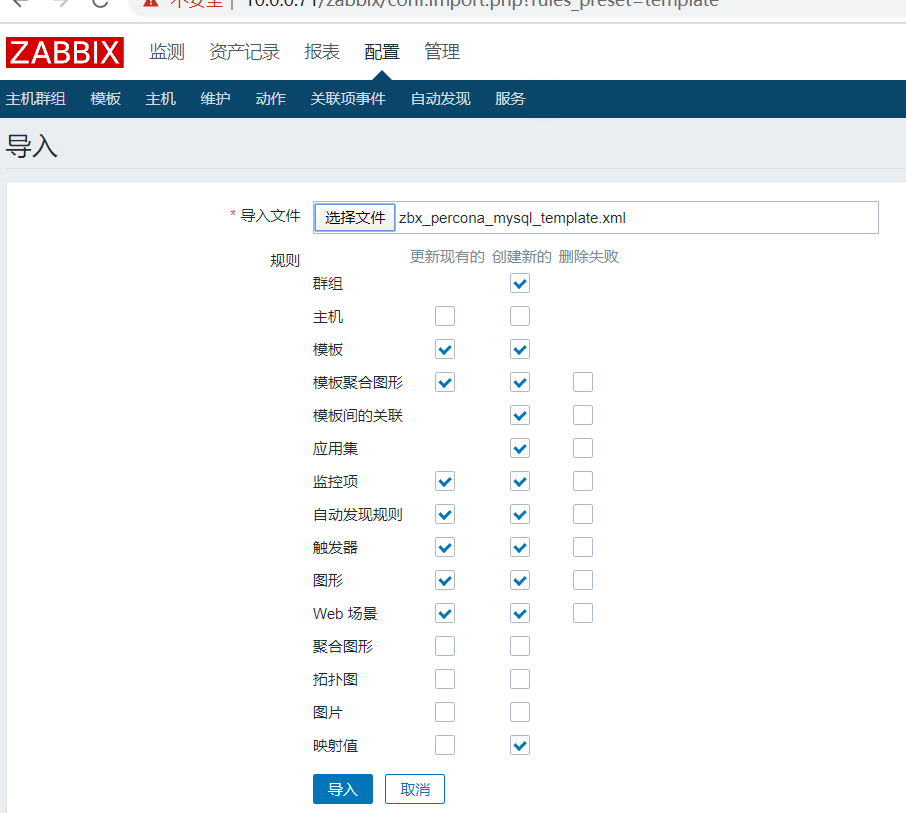
 导入失败,原因为版本问题

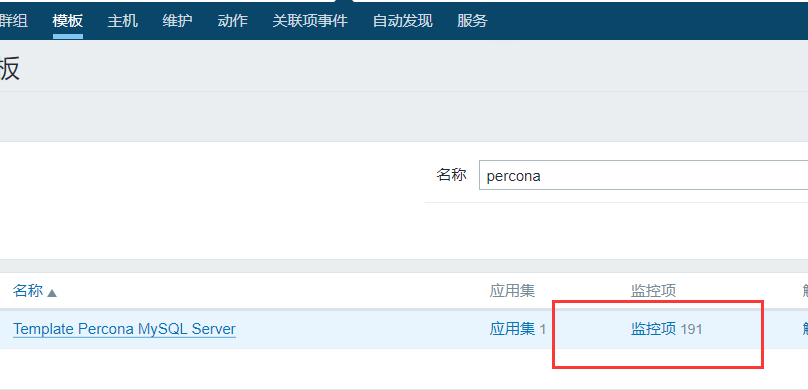
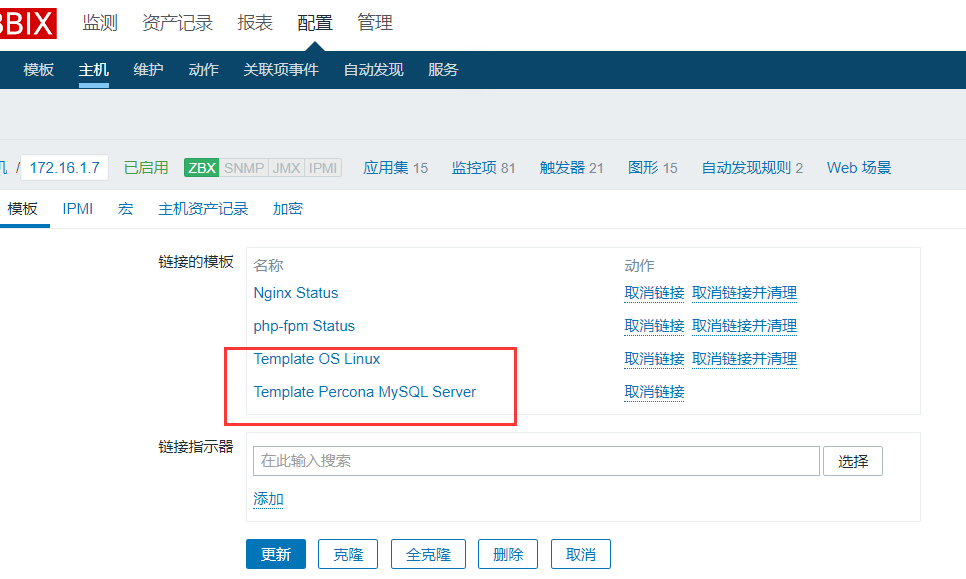 模板关联主机
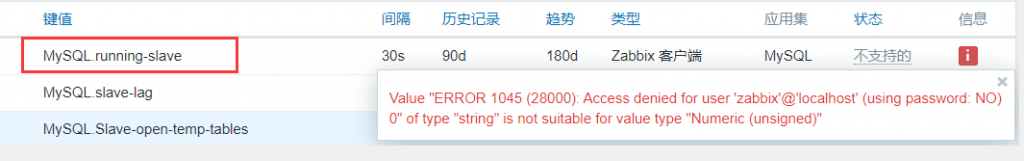 报错:runngin-slave不支持
#报错原因在于数据库权限问题
Value "ERROR 1045 (28000): Access denied for user 'zabbix'@'localhost' (using password: NO)
 0" of type "string" is not suitable for value type "Numeric (unsigned)"

#修改如下
[root@web01 /etc/zabbix/zabbix_agentd.d]# grep  'zabbix' /var/lib/zabbix/percona/scripts/get_mysql_stats_wrapper.sh
     RES=HOME=~zabbix mysql -uzabbix -p123456 -e 'SHOW SLAVE STATUS\G' | egrep '(Slave_IO_Running|Slave_SQL_Running):' | awk -F: '{print $2}' | tr '\n' ','
监控Redis服务
#安装redis服务
[root@web01 /etc/zabbix/zabbix_agentd.d]# yum install -y redis

#启动服务
[root@web01 /etc/zabbix/zabbix_agentd.d]# systemctl  start  redis

#查看redis状态信息
[root@web01 /etc/zabbix/zabbix_agentd.d]# redis-cli  info
# Server
redis_version:3.2.12
redis_git_sha1:00000000
redis_git_dirty:0
redis_build_id:7897e7d0e13773f
redis_mode:standalone
os:Linux 3.10.0-957.el7.x86_64 x86_64
arch_bits:64
multiplexing_api:epoll
gcc_version:4.8.5
process_id:117887
run_id:d24e6540c6a4773bd1370471d26251fe8ec70d14

#取值脚本
[root@web01 /etc/zabbix/scripts]# cat redis_status.sh
#!/bin/bash
R_COMMAND="1"
R_PORT="6379" #根据实际情况调整端口
R_SERVER="127.0.0.1" #根据具体情况调整IP地址
PASSWD="" #如果没有设置Redis密码,为空即可
redis_status(){
    (echo -en "AUTHPASSWD\r\nINFO\r\n";sleep 1;) | /usr/bin/nc "R_SERVER" "R_PORT" > /tmp/redis_"R_PORT".tmp
    REDIS_STAT_VALUE=(grep "R_COMMAND:" /tmp/redis_"R_PORT".tmp | cut -d ':' -f2)
    echo "REDIS_STAT_VALUE"
}
caseR_COMMAND in
    used_cpu_user_children)
        redis_status "R_PORT" "R_COMMAND"
        ;;
    used_cpu_sys)
        redis_status "R_PORT" "R_COMMAND"
        ;;
    total_commands_processed)
        redis_status "R_PORT" "R_COMMAND"
        ;;
    role)
        redis_status "R_PORT" "R_COMMAND"
        ;;
    lru_clock)
        redis_status "R_PORT" "R_COMMAND"
        ;;
    latest_fork_usec)
        redis_status "R_PORT" "R_COMMAND"
        ;;
    keyspace_misses)
        redis_status "R_PORT" "R_COMMAND"
        ;;
    keyspace_hits)
        redis_status "R_PORT" "R_COMMAND"
        ;;
    keys)
        redis_status "R_PORT" "R_COMMAND"
        ;;
    expired_keys)
        redis_status "R_PORT" "R_COMMAND"
        ;;
    evicted_keys)
        redis_status "R_PORT" "R_COMMAND"
        ;;
    connected_clients)
        redis_status "R_PORT" "R_COMMAND"
        ;;
    changes_since_last_save)
        redis_status "R_PORT" "R_COMMAND"
        ;;
    blocked_clients)
        redis_status "R_PORT" "R_COMMAND"
        ;;
    rdb_bgsave_in_progress)
        redis_status "R_PORT" "R_COMMAND"
        ;;
    aof_rewrite_in_progress)
        redis_status "R_PORT" "R_COMMAND"
        ;;
    used_memory_peak)
        redis_status "R_PORT" "R_COMMAND"
        ;;
    used_memory)
        redis_status "R_PORT" "R_COMMAND"
        ;;
    used_cpu_user)
        redis_status "R_PORT" "R_COMMAND"
        ;;
    used_cpu_sys_children)
        redis_status "R_PORT" "R_COMMAND"
        ;;
    total_connections_received)
        redis_status "R_PORT" "R_COMMAND"
        ;;
    cluster_enabled)
        redis_status "R_PORT" "R_COMMAND"
            ;;
        *)
                echo "USAGE:0 {used_cpu_user_children|used_cpu_sys|total_commands_processed|role|lru_clock|latest_fork_usec|keyspace_misses|keyspace_hits|keys|expired|expired_keys|connected_clients|changes_since_last_save|blocked_clients|rdb_bgsave_in_progress|used_memory_peak|used_memory|used_cpu_user|used_cpu_sys_children|total_connections_received|aof_rewrite_in_progress|cluster_enabled}"
esac

#客户端监控项文件
[root@web01 /etc/zabbix/zabbix_agentd.d]# cat redis.conf
UserParameter=redis_status[*],/bin/bash /etc/zabbix/scripts/redis_status.sh "$1"

#添加启动权限
[root@web01 /etc/zabbix/scripts]# chmod +x redis_status.sh

#测试脚本
[root@web01 /etc/zabbix/scripts]# sh redis_status.sh  used_cpu_sys_children
0.00

#删除临时文件,避免权限问题
[root@web01 /etc/zabbix/scripts]# rm -f /tmp/redis_6379.tmp

#重启zabbix客户端
[root@web01 /etc/zabbix/scripts]# systemctl  restart zabbix-agent.service

#服务端取值
[root@zabbix-server ~]# zabbix_get  -s 172.16.1.7 -p10050 -k   redis_status[used_cpu_sys_children]
0.00
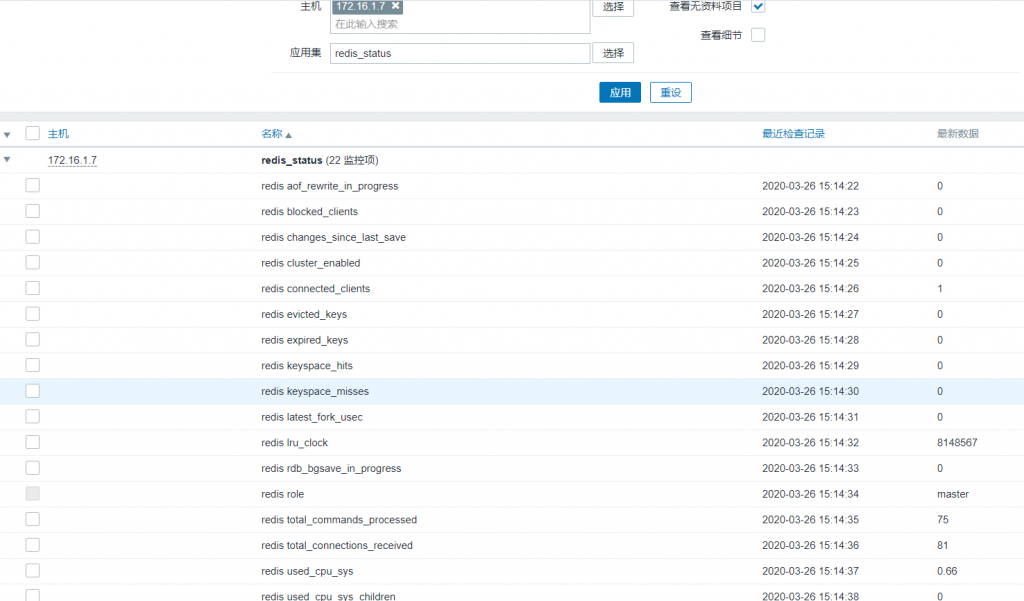 导入模板>链接模板到主机>查看最新数据
 报错:不支持的项目
https://blog.csdn.net/qq_34355232/article/details/82658687?depth_1-utm_source=distribute.pc_relevant.none-task&utm_source=distribute.pc_relevant.none-task #不支持项目解决方法
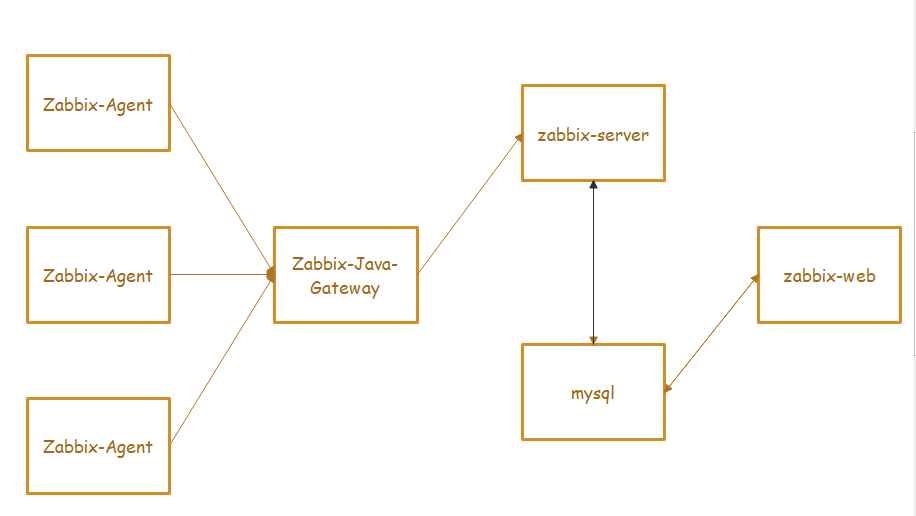
JMX监控
Java环境

代理程序: zabbix-Java-gateway

Zabbix-server找Zabbix-Java—Gateway进行获取Java数据

Zabbix-Java—Gateway就会找Zabbix-Agent进行获取数据

Zabbix-Agent将收集的数据返回给Zabbix-Java—Gateway

Zabbix-Java—Gateway收到数据之后将数据返回给Zabbix-server

Zabbix-server进行将数据展示
#新增一台主机,IP为10.0.0.8
#安装Java环境
[root@tomcat ~]# mkdir /application
#准备文件
[root@tomcat ~]# ll
total 195208
-rw-r--r-- 1 root root 9128610 2019-03-27 16:40 apache-tomcat-8.0.27.tar.gz
-rw-r--r-- 1 root root 170023183 2018-08-14 11:05 jdk-8u181-linux-x64.rpm
-rw-r--r-- 1 root root 20729792 2020-03-26 15:22 jpress-web-newest.war
#安装jdk
[root@tomcat ~]# rpm -ivh jdk-8u181-linux-x64.rpm
#解压tomcat
[root@tomcat ~]# tar xf apache-tomcat-8.0.27.tar.gz -C /application/
[root@tomcat ~]# ll /application/
total 0
drwxr-xr-x 9 root root 160 2020-03-26 16:12 apache-tomcat-8.0.27
[root@tomcat ~]# ln -s /application/apache-tomcat-8.0.27/ /application/tomcat
#添加环境变量
[root@tomcat ~]# echo "TOMCAT_HOME=/application/tomcat" >>/etc/profile
[root@tomcat ~]# source /etc/profile
[root@tomcat ~]# echo $TOMCAT_HOME
/application/tomcat
#启动tomcat
[root@tomcat ~]# /application/tomcat/bin/startup.sh
[root@tomcat ~]# netstat -lntp | grep java
tcp6 0 0 :::8009 :::* LISTEN 8153/java
tcp6 0 0 :::8080 :::* LISTEN 8153/java
tcp6 0 0 127.0.0.1:8005 :::* LISTEN 8153/java
#移动jpress文件
[root@tomcat ~]# mv jpress-web-newest.war /application/tomcat/webapps/
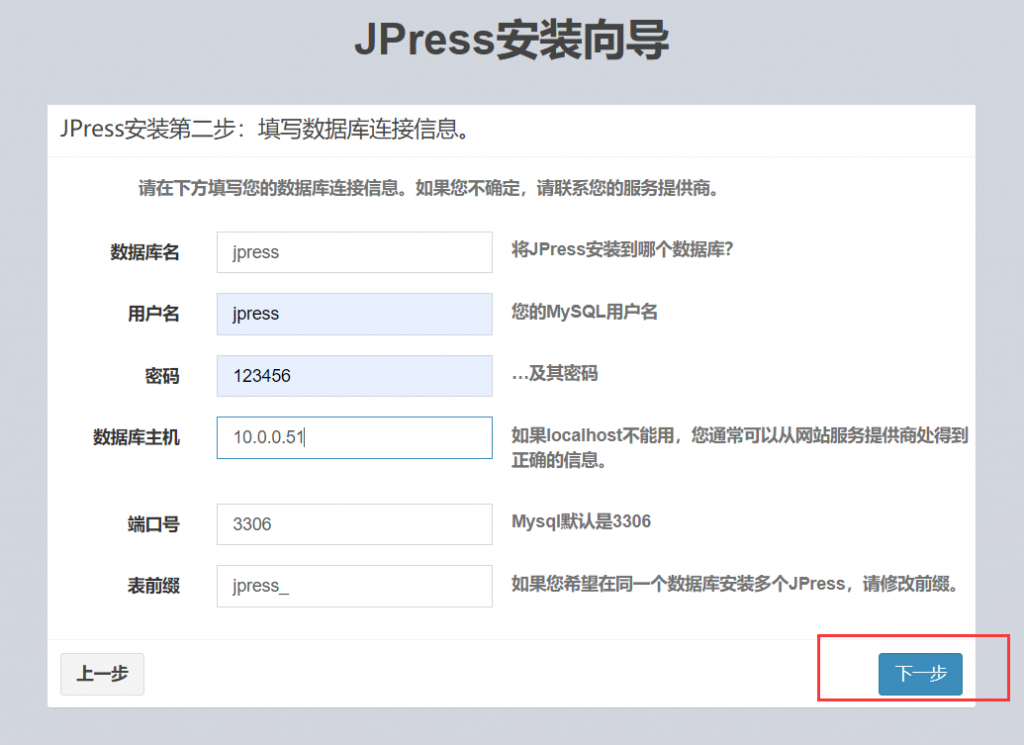
#web界面进行访问
http://10.0.0.8:8080/jpress-web-newest/install
#可以删除ROOT,将jpress-web-newest重命名为ROOT,这样就可以通过http://10.0.0.8:8080/访问


#创建数据库
[root@db01 ~]# mysql
MariaDB [(none)]> create  database  jpress;

MariaDB [(none)]> grant all on jpress.* to jpress@'10.0.0.%' identified by '123456';

#登录后台的网址
http://10.0.0.8:8080/jpress-web-newest/admin/login
#编辑/application/tomcat/bin/catalina.sh (注意参数中间不能换行!否则会报错command not found)
[root@tomcat ~]# vim  /application/tomcat/bin/catalina.sh

CATALINA_OPTS="CATALINA_OPTS \
-Dcom.sun.management.jmxremote \
-Djava.rmi.server.hostname=10.0.0.8 \
-Dcom.sun.management.jmxremote.port=12345 \
-Dcom.sun.management.jmxremote.ssl=false \
-Dcom.sun.management.jmxremote.authenticate=false"

#配置解析
[root@tomcat ~]# cat /etc/hosts
127.0.0.1   localhost localhost.localdomain localhost4 localhost4.localdomain4
::1         localhost localhost.localdomain localhost6 localhost6.localdomain6
172.16.1.8  tomcat

#重启tomcat
[root@tomcat ~]# /application/tomcat/bin/shutdown.sh
[root@tomcat ~]# /application/tomcat/bin/startup.sh

[root@tomcat ~]# netstat  -lntp  | grep  12345
tcp6       0      0 :::12345                :::*                    LISTEN      9513/java

#安装zabbix-Java-Gateway

[root@zabbix-server ~]# yum install   -y  https://mirrors.aliyun.com/zabbix/zabbix/4.0/rhel/7/x86_64/zabbix-java-gateway-4.0.18-1.el7.x86_64.rpm

#编辑配置文件
[root@zabbix-server ~]# grep -Ev '^#|^' /etc/zabbix/zabbix_java_gateway.conf
LISTEN_IP="0.0.0.0"
LISTEN_PORT=10052
PID_FILE="/var/run/zabbix/zabbix_java.pid"
START_POLLERS=5
TIMEOUT=10

#启动zabbix-java-Gateway

[root@zabbix-server ~]# systemctl  start zabbix-java-gateway.service
[root@zabbix-server ~]# systemctl  enable zabbix-java-gateway.service

#编辑zabbix-server配置文件

[root@zabbix-server ~]# grep -Ev '^#|^$'  /etc/zabbix/zabbix_server.conf
LogFile=/var/log/zabbix/zabbix_server.log
LogFileSize=0
PidFile=/var/run/zabbix/zabbix_server.pid
SocketDir=/var/run/zabbix
DBHost=172.16.1.51
DBName=zabbix
DBUser=zabbix
DBPassword=zabbix
JavaGateway=127.0.0.1
JavaGatewayPort=10052
StartJavaPollers=5
SNMPTrapperFile=/var/log/snmptrap/snmptrap.log
Timeout=4
AlertScriptsPath=/usr/lib/zabbix/alertscripts
ExternalScripts=/usr/lib/zabbix/externalscripts
LogSlowQueries=3000

[root@zabbix-server ~]# systemctl  restart  zabbix-server.service

#安装zabbix-agent

[root@tomcat ~]# yum install -y https://mirrors.aliyun.com/zabbix/zabbix/4.0/rhel/7/x86_64/zabbix-agent-4.0.18-1.el7.x86_64.rpm

[root@tomcat ~]# grep  '^Server='  /etc/zabbix/zabbix_agentd.conf
Server=172.16.1.71

#重启客户端

[root@tomcat ~]# systemctl  restart  zabbix-agent.service
[root@tomcat ~]# systemctl  enable zabbix-agent.service
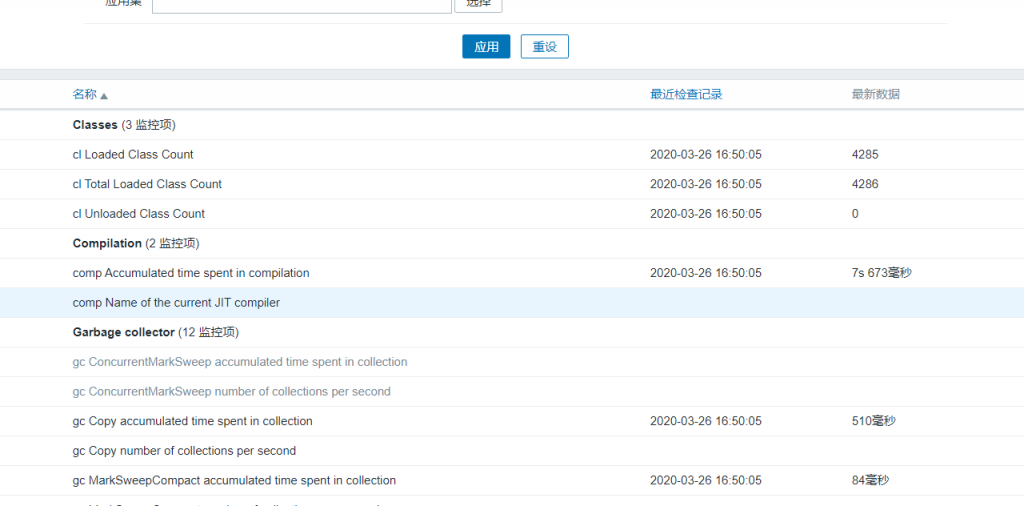
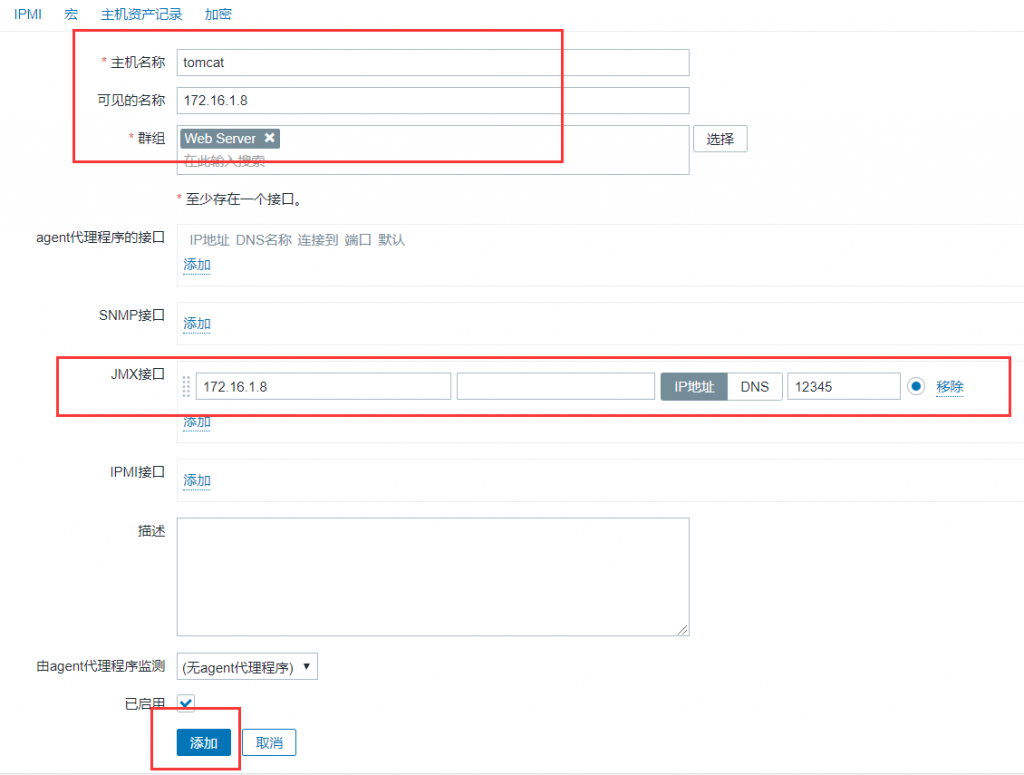 zabbix web上创建tomcat主机
 为主机链接模板
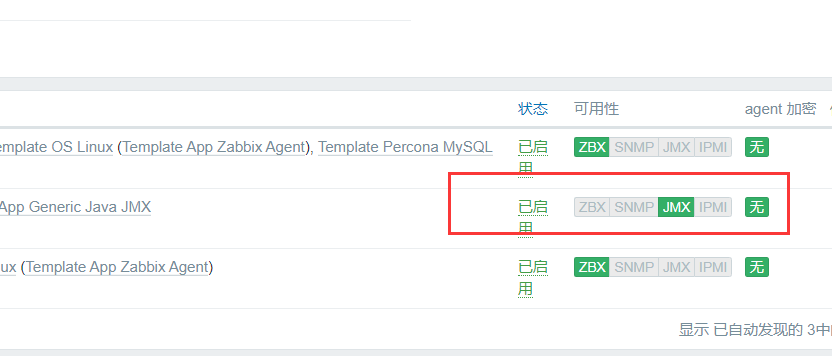 说明主机可用
Copyright © 2009 - Now . XPBag.com . All rights Reserved.
夜心的小站 » Zabbix 应用服务监控 Nginx Redis PHP MySQL
夜心的小站 » Zabbix 应用服务监控 Nginx Redis PHP MySQL


